

Page load speed, among other Core Web Vitals, is a well-known Google organic ranking factor. Although we have the PageSpeed Insights tool, unfortunately it only works on one page at a time.
The Universal Analytics Page Time report showed specific pages on your site that were slowest, allowing you to prioritize which pages to evaluate and optimize.
The tool was especially useful if you have a large site with thousands of pages to analyze. Armed with the list of problematic URLs, you can prioritize pages for review using the PageSpeed Insights tool.
But Google didn’t include page time reporting in GA4, so where can you find similar information now?
Below are several free and paid tools that can help you identify your problem pages and prioritize optimization.
1. Google Search Console
Pros: Free.
Cons: Highly manual, no API connections.
Google Search Console (GSC) provides a Core Web Vitals report and even separates data by mobile device and desktop.
However, while GSC provides some examples of affected URLs, it does not provide a complete list. Instead, it groups the pages and shows examples of the group. Nor can the data be easily downloaded to a CSV for tracking.
If your goal is regular tracking, you’ll need to log into GSC and review the tool data. The GSC API does not support exporting core data from web vital data reports, so you cannot pull data from GSC into Looker Studio or other visualization tools.
2. Screaming frog
Pros: Deeply indexes sites, connects to the PageSpeed Insights API (with a key you provide), scheduling is available.
Cons: Payment tool, desktop based.
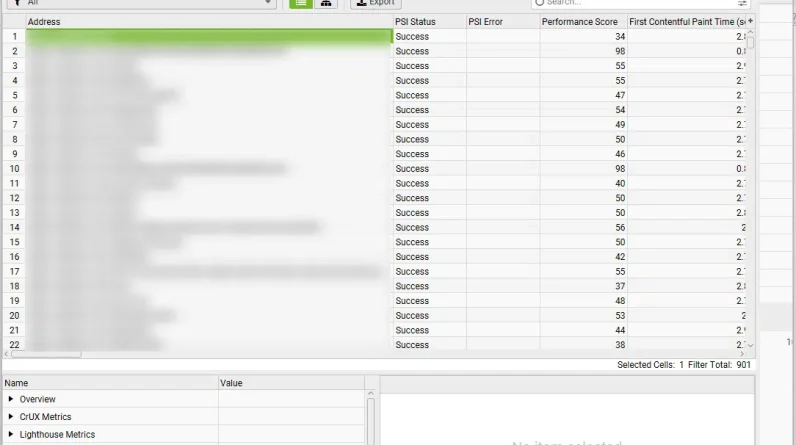
A long-time favorite of SEO professionals, Screaming Frog software has many useful SEO applications, but the most important thing in this article is that it provides page load times.
In addition, you can connect to the PageSpeed Insights tool using a key from the PageSpeed Insights API to import data from Core Web Vitals directly into the PageSpeed report:
The only real downside to Screaming Frog is that since it’s a desktop application, the computer you’re hosting it on must be turned on and connected to the web when the report runs. This makes the tool less optimal for dashboarding and very regular data tracking.
An alternative solution is to have a desktop computer always on. I did this at my agency for many years on an old, dedicated desktop computer running Screaming Frog.
Since the tool allows scheduling, the scheduled report can be run at the set time as long as the computer is on and connected to the Internet. Additionally, you can connect Screaming Frog to a Google Drive account and export report tabs to Google Sheets:
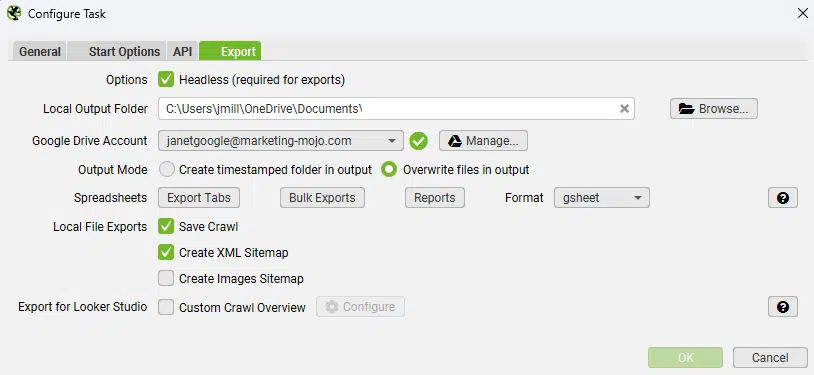
If you want to use the upload for the dashboard, choose the Overwrite files on output option, which will allow you to update the Google Sheet itself.
Once the data is in a Google Sheet, you can import it into other platforms, such as Looker Studio, to create dashboards and visualizations, or create thresholds to send email alerts using Apps Script.
Get the daily search newsletter marketers trust.
3. Ahrefs
Pros: Deeply indexes sites, available schedule, cloud-based app, connects to the PageSpeed Insights API (with a key you provide).
Cons: payment tool, manual data export.
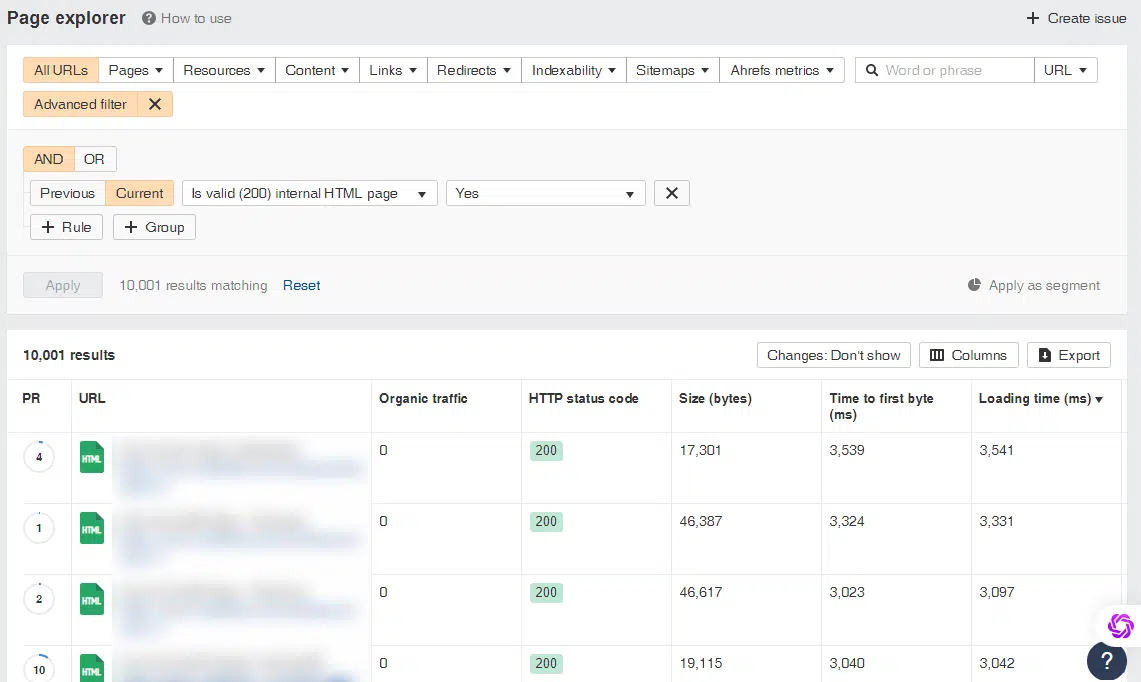
Ahrefs has long been an SEO favorite for tracking backlinks, but the tool also has a robust site audit tool that tracks page load speed while indexing a website
Like Screaming Frog, you can plug PageSpeed Insights directly into your site audit to see specific vital web core optimizations that need to be done:
While you can export reports to Google Sheets, it’s a manual process. Site audits can be scheduled periodically.
Unfortunately, the Ahrefs API doesn’t seem to have a way to automatically export the results, making it a bit of a manual process and less than ideal for near real-time dashboarding and reporting.
4. Semrush
Pros: Deeply indexes sites, available schedule, cloud-based app, connects to PageSpeed Insights API (no key required).
Cons: payment tool, manual data export.
Another popular SEO tool is Semrush, and it also has a site audit feature that reviews page load speed and lists the pages with the longest load times:
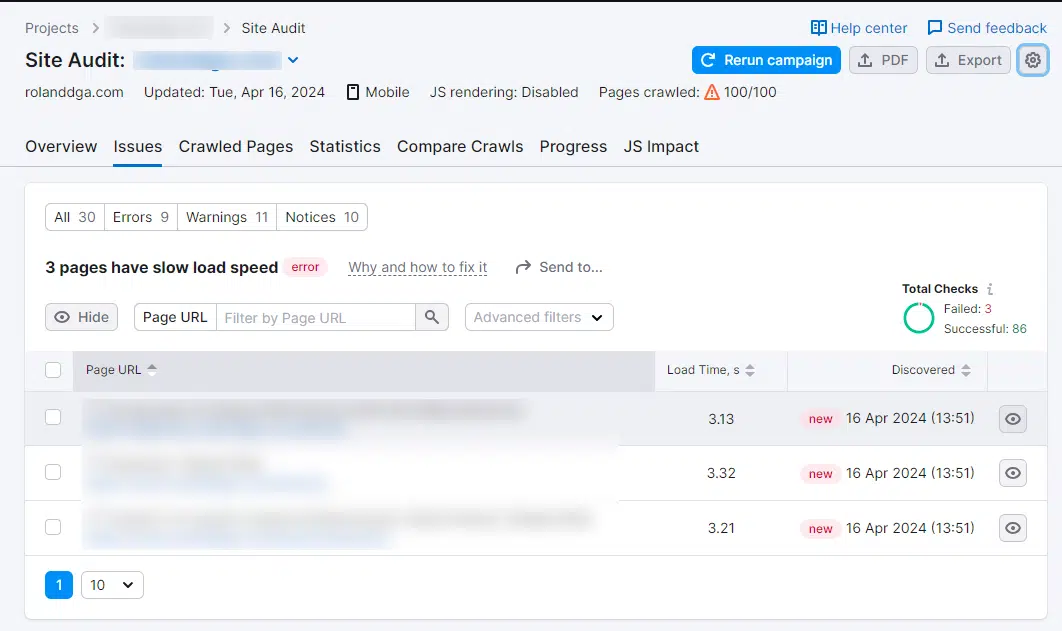
Unlike Ahrefs and Screaming Frog, you don’t need to enter a personal PageSpeed Insights API key to plug basic SEO information directly into your audit.
Again, with this tool, however, exporting data from this report is manual. However, Semrush has an API and will report page load speed issues. However, the API is only available for Enterprise and higher plans, which start at $499 per month.
5. Add page speed to GA4 using custom dimensions
Pros: Free, measures real user data for page-by-page loading speed, no programming required, cloud-based application.
Cons: Only starts tracking data once implemented (no historical data), does not automatically connect to the PageSpeed Insights API.
Another option to restore page load speed in Google Analytics is to create a custom dimension. You can use this custom dimension to create a scan report, import data into Looker Studio, or export data using the GA4 API or various tools that incorporate the API.
Mesura school has one excellent tutorial on how to track page load speed using Google Tag Manager and custom dimensions in GA4.
Several free and paid tools can export your list of slow pages using the custom dimension to Google Sheets, including the free Google Sheets extension GA4 Report Builder for Google Sheets.
Unlike its predecessor in Universal Analytics, this extension has no programmability. I personally use Supermetrics, which is a paid tool but gives me access to various APIs, including GA4, and allows me to schedule reports.
Connecting to the PageSpeed Insights API
However, once you have the list of the slowest pages on the site, you’re not quite done! Screaming Frog, Ahrefs, and Semrush introduce Core Web Vitals optimizations to their platforms using the PageSpeed Insights API.
If you don’t use one of these tools, you’ll need to query each URL in the PageSpeed Insights tool manually, one by one, or you can use the PageSpeed Insights API to make these queries.
If you’re not a web developer or have no coding knowledge, luckily there are tools you can use to take advantage of the APIs, including the PageSpeed Insights API, to get the specific details of basic web vitals you need to optimize .
My personal favorite is Zapier, which has a zap webhook that allows even non-developers a simplified way to plug your list of slow URLs into PageSpeed Insights and enter the most important data points:
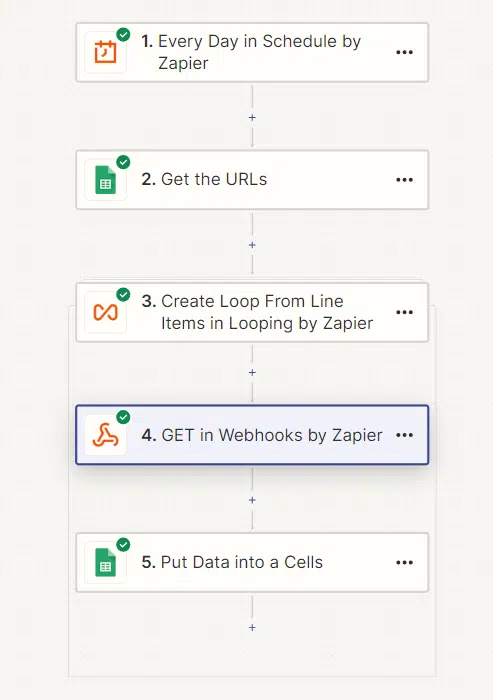
Image optimization can often be a quick way to improve page load speed. In the zap example above, I only enter image details for each URL of a site with more than 10,000 pages. This gives me a quick way to find:
Which pages are slowest? Of these pages, which ones are slow due to images needing to be resized. Make a list of the images that should be resized and prioritize them by the largest load time saved per image.
The advantage of this approach is that it can actually provide near-real-time reporting and dashboards, while the other solutions still have drawbacks that make them less than ideal for dashboard reporting.
However, continue to measure page load speed for organic search optimization, each solution requires some configuration and work. So, if you haven’t started with a fix yet, get started right away so you can quickly get quick SEO wins and improve your struggling pages.
The views expressed in this article are those of the guest author and not necessarily Search Engine Land. Staff authors are listed here.
[ad_2]
Source link