

You’ve probably used Looker Studio (formerly Google Data Studio) to create reports for stakeholders or clients.
I recently had the pleasure of seeing SearchLab’s Greg Gifford on “Freddy Krueger’s Guide to Good Scary Reporting.” He discussed ways to improve Looker Studio reports to make them more useful for clients.
Below are the key learnings from Gifford’s session in the form of dos and don’ts, along with some examples of data visualizations that search marketers will find most useful.
1. Do not enter data into a text box manually
Work smarter, not harder. Set up a data source for the platform to pull data instantly.
You can connect it to a specific Google Ads account and report metrics directly from there.
There are many plugins built and supported by Looker Studio.
However, if you want to connect a platform that isn’t on this list, you can do so using a third-party data integrator like Supermetrics or Funnel.io.
You can export data to a Google Spreadsheet and bring it into Looker Studio that way.
2. Don’t include metrics without comparison
Customers pay you to tell them a story, not to spit out numbers that can already be found on their own.
Why are clicks down compared to last month? Why did the conversion rate drop by a whole percentage? Last month there were 40 tracks. How does it compare to last month or this time last year?
Show them what trends you’re seeing in an easy-to-understand way.
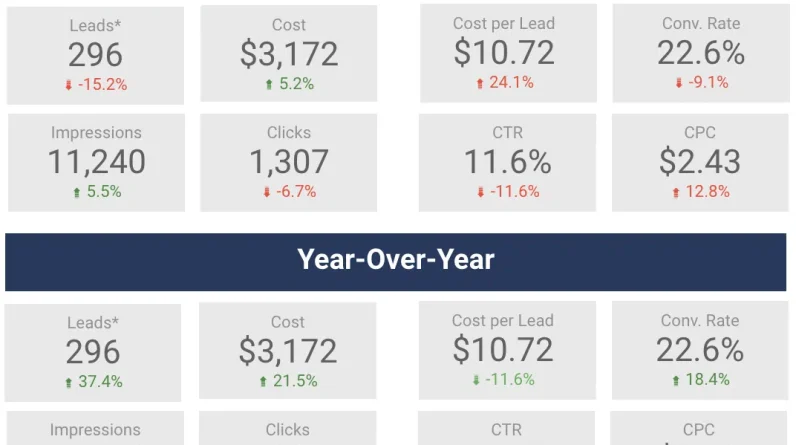
Here is an example.
This is a way to demonstrate month-over-month (MoM) and year-over-year (YoY) changes for specific metrics.
You can add them by clicking on the metric, navigating to the Settings section, and adding a comparison date range.
Looker Studio will automatically calculate the percentage change and turn it green or red based on a positive or negative trend.
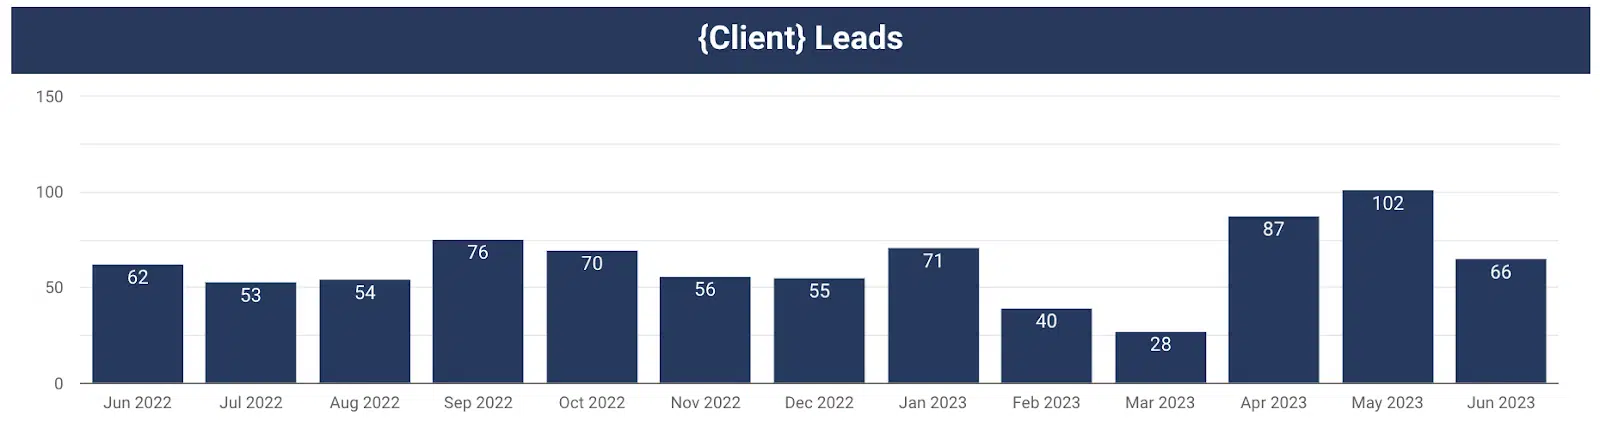
This chart provides a visual representation of leads by month over time.
You can easily see month-on-month (MMS) and year-on-year (YoY) changes. Consider a chart like this for your report.
3. Don’t give them metrics that don’t tell them the whole story
Time on site is a commonly reported metric. It is usually assumed that the more time a user spends on the website, the better.
Gifford challenged that mindset. Could spending more time on your website mean that people can’t find what they really need?
If they come to your website, find your contact form, fill out their information, and leave within 45 seconds, that’s actually a good thing.
As long as they convert, you should be happy (and the faster they convert, the better).
Challenge yourself to choose metrics to report that will give you a more accurate picture of what’s going on.
Get the daily search newsletter marketers trust.
So now you know what no do. Let’s talk about what to do with your Looker Studio reports.
4. Provide an executive summary, a list of work done, and a list of next steps
This is undoubtedly the most important part of the report.
This should serve as a fact sheet so the client has a place to quickly refer to the most important ideas from this past month.
Everything else in the report is complementary and helps provide additional color to the trends and insights you’ve provided in your executive summary.
As you think about crafting your executive summaries, ask yourself, “So what?”
My client saw 40 leads this month, so what? Traffic increased by 25% month over month, so what?
Use the executive summary to tell a story to your client and give them the Because.
Tell them how your traffic increased 25% month over month because the unbranded campaign you restructured performed efficiently and generated 80% of your total leads for the month.
Also, now that you’ve seen how well your campaign restructuring is working, the next step is to restructure another campaign to further improve performance in the same way.
Boom!
Now you’ve told your client what happened, why it happened, and what you plan to do next as a result.
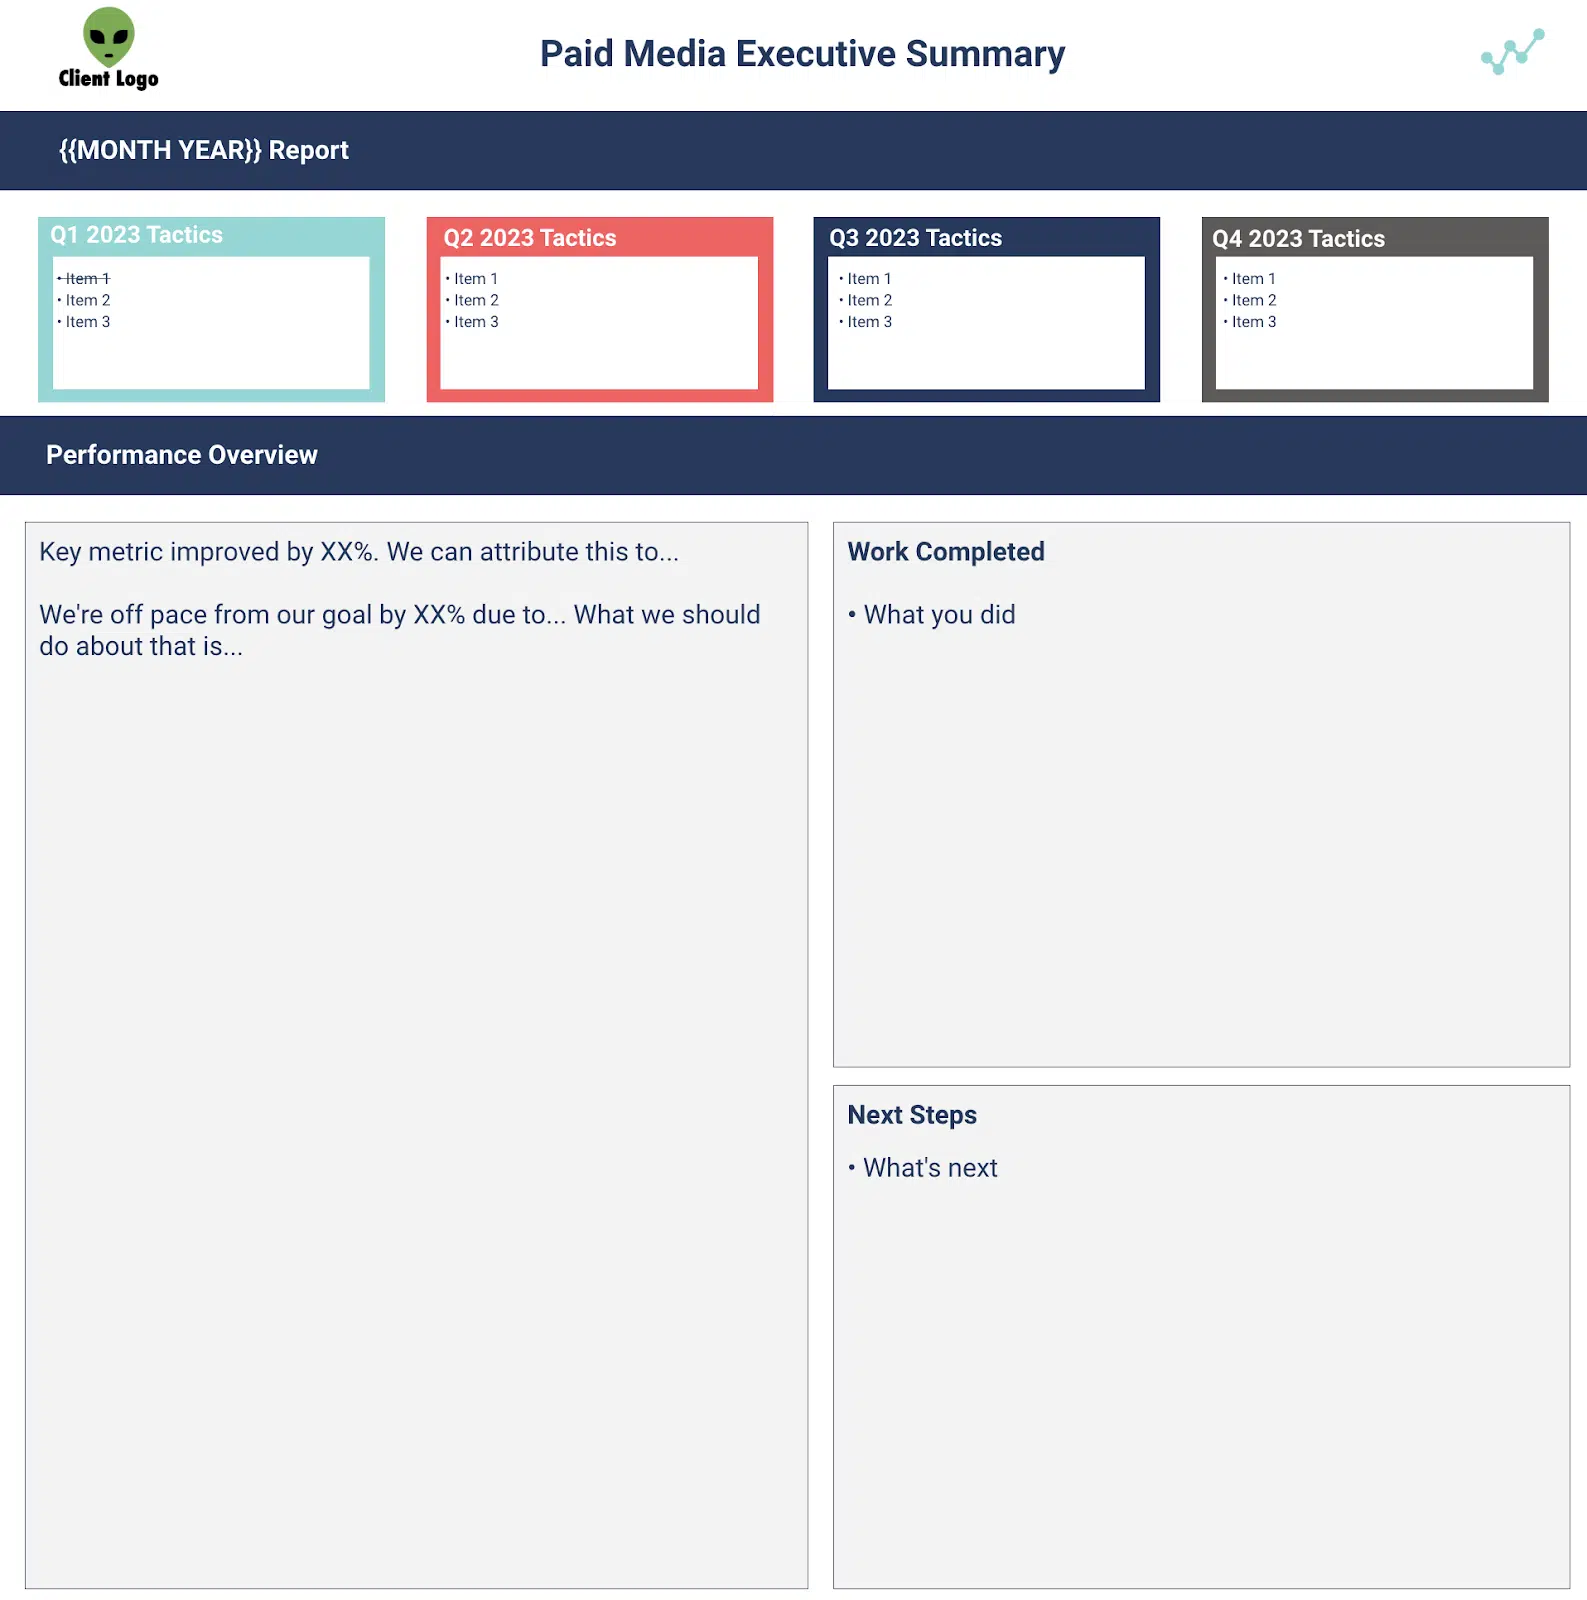
See an example executive summary template below.
5. Give a visual representation of the trend towards your key performance indicators (KPIs)
It is imperative to align KPIs with your client before creating a report.
If you don’t have a goal you’re trying to achieve, how can you prove your value to a client?
Think of it this way:
Put yourself in the customer’s shoes. Which one sounds better to you?
“We generated 40 leads in July.”
or
“We generated 40 leads in July, which is double our goal of 20.”
We bundle all of this into your Looker Studio report.
Show your client that you’ve exceeded your KPIs, don’t just tell them.
Below is an example of how to view your KPI progress.
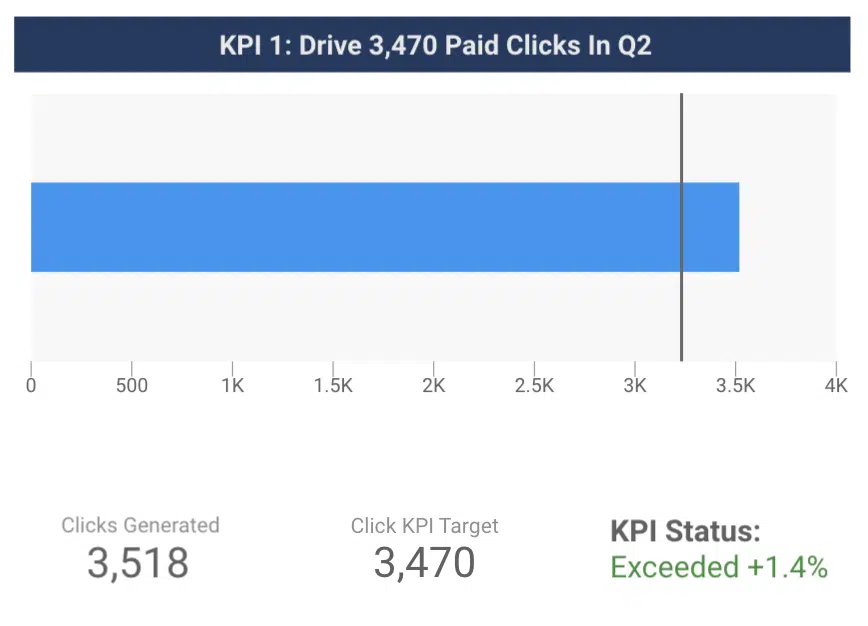
The blue bar shows the number of clicks generated in a given time period.
The line shows the click KPI for the given time period.
The customer can now easily see that you have exceeded the target.
6. Gather data that answers your customers’ questions
Think about formatting each chart as if you were answering a customer’s question, Gifford suggested.
What actions did people take on our website?
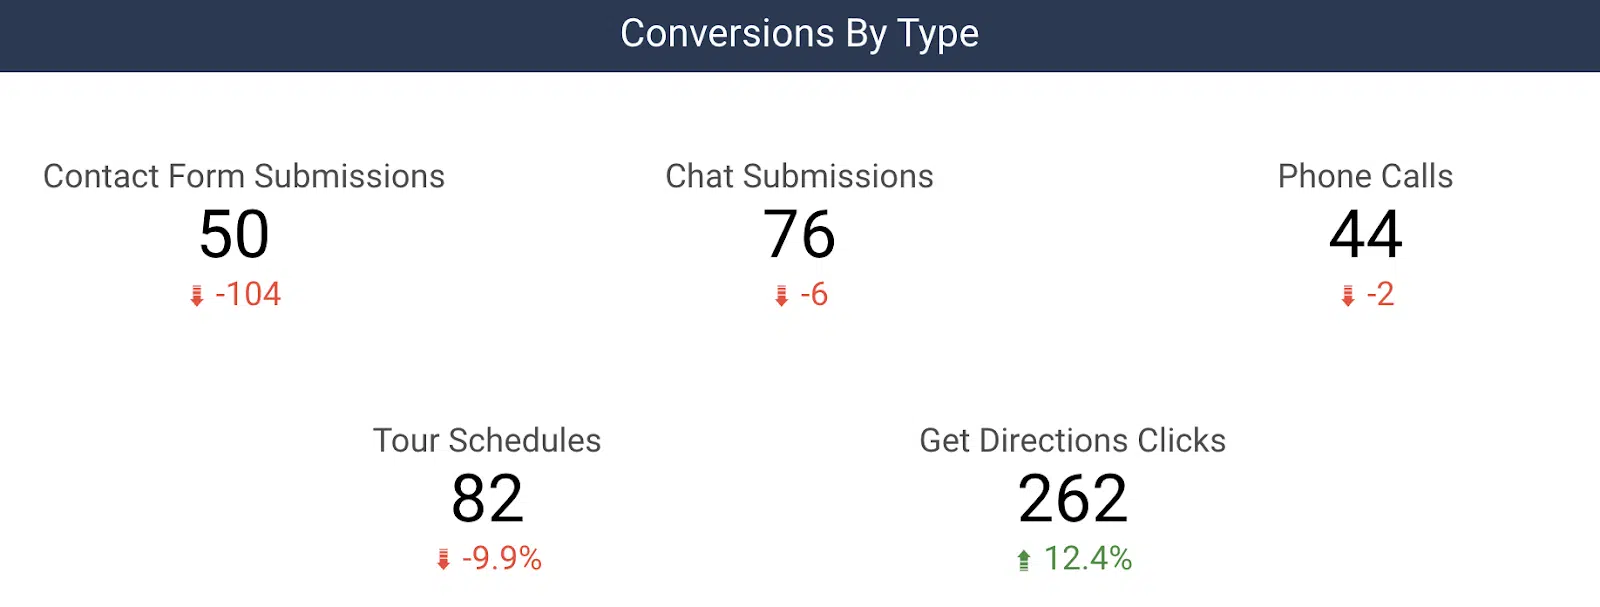
Show them data that describes how many phone calls, contact form submissions, visit times, etc. that they have received from your marketing efforts.
Here’s an example of how to break down conversions by type for a customer:
Another common question we get is, “So you generated 30 leads for us, but what does that mean for my business?”
Connecting contact data to sales is powerful for reporting.
Whether it’s actual revenue (via a CRM import) or estimated revenue (based on average order value), you can unlock additional revenue-based metrics in your reports, such as ROI
You can begin to answer their question by letting them know what percentage of those leads converted to sales, total revenue, and ROI for a given month.
Creating useful customer reports with Looker Studio
Looker Studio is an incredibly powerful reporting tool that reduces the time spent manually typing metrics.
It lets you instantly pull together powerful data visualizations to help tell your digital marketing story.
Now, you have a list of dos and don’ts to help you get started on your way to more valuable customer reports.
The views expressed in this article are those of the guest author and not necessarily Search Engine Land. Staff authors are listed here.
[ad_2]
Source link