

Unless you’ve been away on a desert island for the past 18 months, you know that Google Analytics 4 (GA4) took center stage on July 1st as the source of our web metrics. We had to say goodbye to Universal Analytics (UA), an old friend of many marketers.
One of the biggest challenges marketing teams can face will be comparing a current period of data to historical year-over-year (YOY) data to measure growth success.
There are fundamental changes in how GA4 measures data compared to how UA does it, so comparing data between the two won’t be an apples-to-apples scenario.
The year-over-year apples-to-apples comparison scenario is why there was a big push by many to get GA4 up and running and collecting data by July 1, 2022. This would allow for a true comparison .
So what if you’re one of the procrastinators (don’t feel bad, there are a lot of them!) who won’t be able to do a true apples-to-apples comparison? Well, here’s what you need to know.
Fundamentally different data models
UA was based on sessions and page views. GA4 is based on events and parameters. Both methods can collect and tally data, but the report output will look different.
So what does this mean in plain English?
Different numbers on the metrics you report
You’ll find cases where the metric is called the same thing, so you’re tempted to believe that the number should match exactly (or at least come close). However, you may find some variations.
For example:
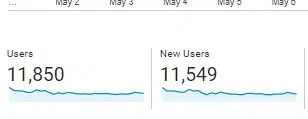
User count
Here is the number of UA users/new users for a small website for a month:
UA count of users and new users
Now here’s the number of GA4 users/new users from the same website for the same exact time period:
 GA4 count of users and new users
In the reporting snapshot, GA4 rounds the numbers, but you can see that the users reported in GA4 are about 8% lower than those seen in UA.
The new users metric is even more pronounced (a difference of almost 14%) if you look at the rounded number. (The actual number reported in GA4 when you break it down is 10,443, a difference of just under 10%).
Sessions
GA4 has a couple of key differences when it comes to counting sessions, which actually make counting more accurate.
Although both platforms have a default session timeout setting of 30 minutes, UA resets the session at midnight i generates a new one when a UTM promo code is clicked.
If you could follow this, basically the “session count” numbers you’ve been reporting all along aren’t exactly an accurate count.
GA4 does it no reboot at midnight and it does no generate a new session if a UTM promo code is clicked.
For example, I’ve seen some websites put a promotional UTM code in a link to an internal page (bad idea and unnecessary, by the way).
In the UA, this causes a new session to be started i overwrite any other UTM promo codes that may have driven traffic.
Conversions
The way conversions are calculated between the two platforms is different.
UA will only count one conversion per session for each goal. So, for example, a user clicks “click to call” multiple times.
However, the user does not follow through and cancels before the call goes through the first time. Only one conversion will count towards this goal.
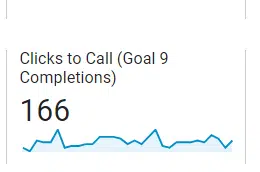
Here’s an example of setting up the Clicks to Call goal in UA:
 Clicks to call the achievement of objectives in UA
Instead, GA4 will count a conversion every time even if the same conversion event is recorded multiple times during a session (same user, same site, same visit):
 Click to call achievement of objectives in GA4
Understanding the proper context is important here.
On the one hand, you could argue that GA4 increases the actual number of conversions, since you essentially have the same person clicking the “call” link multiple times (presumably for a single purpose).
On the other hand, you could argue that all you cared about was whether the user converted the call to action, not how many attempts they made in a particular session. Regardless of which method you think is better, the GA4 method is now the way to go.
If we’re talking about an “Add to Cart” conversion where the user put a pair of shoes in a cart, then continued shopping and added socks, GA4 would count that as two conversion events.
You could argue that GA4 counting two conversion events is appropriate (however you choose to look at it).
Get the daily search newsletter marketers trust.
Rethinking our web performance metrics
GA4 gives us a new way to think about business success metrics and what really matters. Here are a couple of examples:
Sessions
We’ve already covered the differences in how the two platforms calculate sessions, but GA4 makes us think about sessions that actually lead to meaningful engagement on the site.
One of the first prominent messages you’ll notice is “Sessions Engaged”, which is simply a count of sessions where the user actually did something.
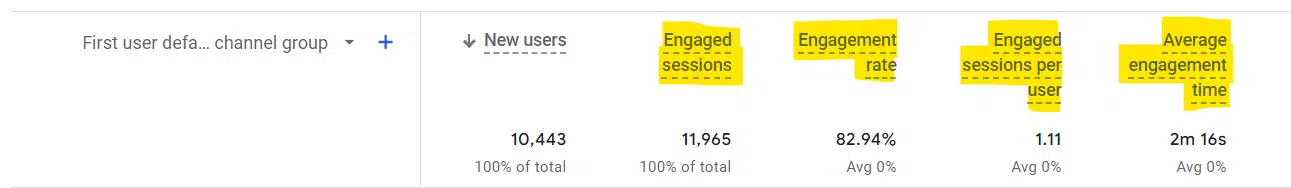 Engagement metrics
An “interactive session” can only be considered if it lasts longer than 10 seconds, has one or more conversion events, or has two or more page/screen views.
You may or may not agree, but this is what GA4 uses for its standard. “Session engaged” is not a canned metric in UA.
Bounce percentage
For a generation, marketers loved to report a low bounce rate as a measure of success. However, it’s not always a great metric. As with any success metric, context is king.
For example, a simple recipe page might do its job perfectly, but show a high bounce rate.
The user got what they came for (the recipe) and then made a happy exit. Is that bad?
No, actually. It is a good thing for the user.
Bounce percentage is gone as a standalone metric in GA4. Now you can check the engagement rate to show you the percentage of quality visits to the site. (Again, depending on the definition of quality.)
If you start with 100 and subtract the engagement rate from that, in theory you’ll get something like a bounce rate.
Events
How GA4 handles events could easily be the subject of a separate article. (See Event Tracking in Google Analytics 4: What Marketers Need to Know for more details.)
For this article, just a quick high-level reminder of the differences:
In UA, events are used to track site actions that don’t necessarily result in a landing page.
For example, you have a video on your home page. This video plays throughout the tour.
After this video is finished, there is no “Thank You” page that you can easily set as your standard conversion goal. This is where events come in.
UA allows you to give “events” a category, an action, and a label to provide more description and context. An event is counted when an action is triggered. For example, if you have a video on your homepage and track completions.
 An example of a video on the front page of a site
GA4 has no category, action, or tag, so there’s no point in learning it now. And with GA4, everything is an event. For example:
Pages viewed = event
Login = event
First visit = event
Displacement = event
Click = event
Start of video = event
Download file = event
Video Progression = event
Full video = event
Registration in the newsletter = event
Contact Presentation = event
View search results = event
You get the idea.
Anything remotely worth measuring is an event.
Views versus data streams
On UA, you can have a simple website and a mind-boggling number of views set up. You might see different numbers depending on which view you’re looking at, so that was worth understanding.
No more views in GA4. Instead, there are data streams. They can be seen in Admin > Data Streams:
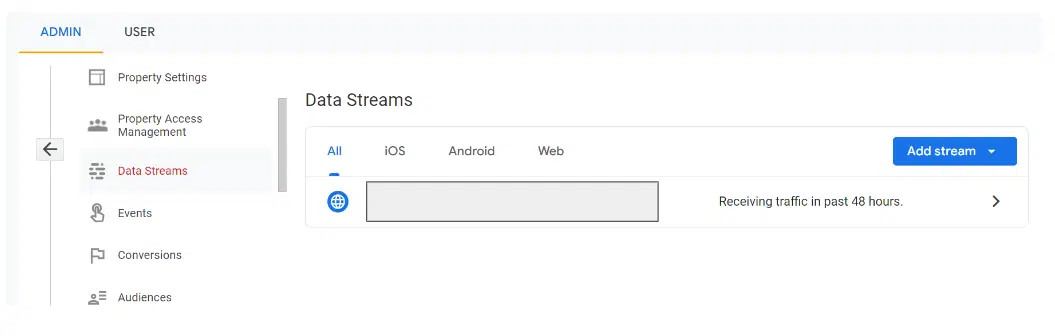
If you’ve previously set up multiple views in UA, you’ll want to check your data flow settings in GA4 to make sure you’re measuring what’s important to your business.
One of the advantages of GA4 is that you can better see a more accurate reflection of the number of users.
For example, a data stream can be a website or an application If your business also has a native mobile app, this can be an advantage.
Moving from UA to GA4
If you didn’t have GA4 up and running before July 1, 2022, you won’t have an apples-to-apples year-over-year comparison for July 2023 data. So be careful how you report the numbers.
If you have no choice but to show UA data from the previous year, please include a large asterisk along with an explanation. Hopefully, this article provides some context and backup information when you’re asked why.
The views expressed in this article are those of the guest author and not necessarily Search Engine Land. Staff authors are listed here.
[ad_2]
Source link