

From the beginning, the central theme of search marketing has been to help consumers find the information and products they are looking for. Therefore, the level of quality is an essential factor that benefits both the advertiser and the consumer.
Quality Score is a useful metric for PPC marketers looking to evaluate the quality of their ads compared to other advertisers.
Google states that “a higher Quality Score means that your ad and landing page are more relevant and useful to someone searching for your keyword, compared to other advertisers.”
An “Average” Quality Score may not mean failure, but it does mean higher CPCs and lower click-through rates and conversions. Today I wanted to dive into some facts that show why you should never be happy with “average.”
This article explores two quality score components related to relevance: landing page experience and ad relevance.
Understand the landing page experience and ad relevance
First, let’s cover some quick definitions:
Landing Page Experience: How relevant and useful your landing page is to users who click on your ad.
Ad relevance: How closely your ad matches a user’s search intent.
(Note: Expected click-through rate is the third metric. I’m ignoring it for simplicity and will focus on relevance.)
Both landing page experience and ad relevance measure how well your keyword matches your ad content and landing page. This doesn’t mean that each keyword variant needs its own landing page.
Instead, you should think about the customer experience and how the flow from the keyword to the ad copy to the landing page can be consistent.
Delivering what the customer expects is always best practice. Google provides this specific example.
The other metric to monitor on your landing page is page speed. The speed with which the site loads is also directly related to the consumer experience. Therefore, having a page that loads quickly and matches the consumer’s intent will be helpful.
How Google evaluates these scores
Google assigns a score for each of these metrics which is:
“Above average” “Average” “Below average”
The score is assigned in comparison to other advertisers whose ads have been shown for the same exact keyword in the last 90 days.
This is useful for advertisers to understand because this score is obtained in comparison to the direct competition of the keyword auction.
Sometimes there is no score assigned and the data will be shown with a “-” in the report. This is just a placeholder for ads that don’t have enough volume to be assigned a score.
Get the daily search newsletter marketers trust.
Looking at performance metrics using landing page experience and ad relevance scores
I pulled three months worth of data on my Google Ads accounts. I then analyzed it to include non-branded keywords.
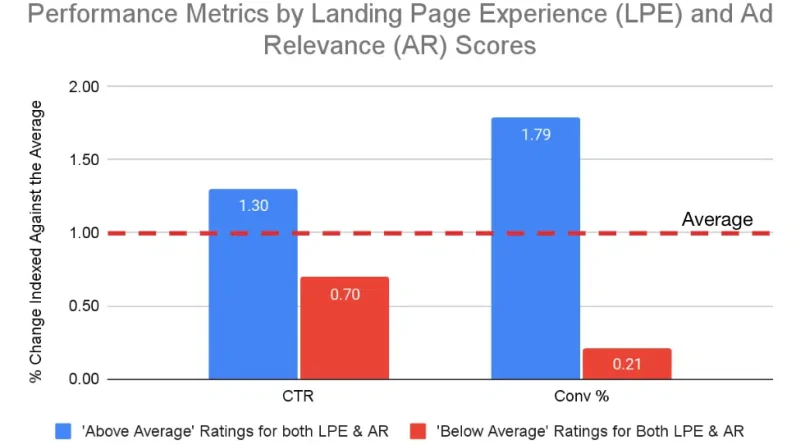
To keep things simple, I’m only sharing data for keywords that received a “Below Average” score for both Landing Page Experience (LPE) and Ad Relevance (AR ), and then I compare them to data that scored “above average” for both metrics. .
The results of this data clearly show how important it is to monitor and improve these scores. Every key metric differs greatly based on these scores, from cost-per-click to conversion rates.
The data set I reviewed showed huge improvements in both landing page experience and ad relevance when comparing keyword results with “above average” scores to those with ” below average” in both.
Click-through and conversion rates were significantly higher for ads with “above average” scores for landing page experience and ad relevance.
CTR was 87% better and conversion rates were 750% better. Remember, these are just unbranded keywords.
The same goes for cost per click. When ratings were above average for both metrics (LPE and AR), CPCs were well below average at 36%.

What does this potentially mean?
Regardless of the metric, Google rewards PPC ads that deliver a better experience. In this case, the rewards are lower costs and a much better conversion rate.
I’m sure if you dig deeper you’ll find other scenarios that help drive these metrics, like competition, match type, etc.
You can drill down into all these specific data points in your accounts and determine how you want to adjust, even at the keyword level.
This data indicates that if two advertisers spend $10,000, the advertiser with “above average” scores for both LPE and AR metrics would receive over 2,000 more clicks and seven times more conversions.
key points
So, now that you understand how Google rewards advertisers who deliver relevant experiences, here are three best practices for improving PPC performance.
Deliver consistent experiences
It’s key that your keyword matches your ad copy and landing page. Improvements to this experience often involve how the account is structured.
Ad copy is generated at the ad group level, so having too many variations of keywords in each ad group could cause problems.
Restructuring the account to align with user experience and narrowly themed ad groups yields excellent results.
Improve your technology
Often, the marketing team can’t make changes quickly, given the subject matter or technology constraints.
Maybe the page is slow to respond because the design is heavy or the code is bloated. Updating these elements to be fast and efficient (for external customers and internal teams) is essential.
The faster your technology is, the more you can test and make rapid improvements that move the business forward.
Don’t overdo it based on these metrics
These Quality Score metrics provide useful information to optimize Google Ads performance.
However, if your campaigns are converting well and achieving their intended purpose, you don’t need to remove them just because you have a low Quality Score.
Ultimately, business metrics should be your source of truth.
Optimizing for landing page experience and ad relevance
The world of search continues to evolve rapidly, but it will still come down to providing the best user experience. If you can do that, you’ll have an excellent chance of winning against the competition.
These metrics provide great insight into where you can improve, but too often go unseen because making these changes requires resources.
I hope that by sharing the direct impact these scores can have on improving your metrics, you’ll find the bandwidth to test and improve your landing page experience and ad relevance scores.
The views expressed in this article are those of the guest author and not necessarily Search Engine Land. Staff authors are listed here.
[ad_2]
Source link