

If you’re a control-loving performance marketer like me, Google hasn’t given you much to smile about lately in its rush into an AI-driven world.
But there is one that has the potential to provide incredibly useful nuance and customization of PPC reports for marketers who know how to use them.
Yes, I’m talking about custom columns, my favorite Google update of 2022.
In this article, you will learn:
What are custom columns? Why Marketers Should Use Custom Columns. The four most important use cases I’ve seen in action.
What are custom columns?
Custom columns are report columns that you can create in the Google Ads user interface to provide metrics and calculations that are important to your specific business.
They allow you to extend your reporting beyond what is pre-built in Google Ads. They’ve been around for almost 10 years, but they got a big update about a year ago that Search Engine Land contributor Greg Finn covered in great depth.
Why Marketers Should Use Custom Columns
There are hundreds, if not thousands, of possible use cases for custom columns.
I’ve found custom columns to be especially useful for businesses with more than one conversion type because you can associate a variety of metrics based on different conversions.
With Google (along with Microsoft, Meta and everyone else) moving towards AI and automation, one of the few controls marketers have left is to feed offline conversion data into Google’s system to improve bid accuracy , orientation, etc. Custom column reports are key to this functionality.
However, for businesses with a single conversion type, custom columns can be used to set up faster and more efficient trend recognition that can help give marketers a competitive edge. It can even prevent Google from being too aggressive with budgeting, as we’ll show in a use case.
Use case 1: Conversion targeting
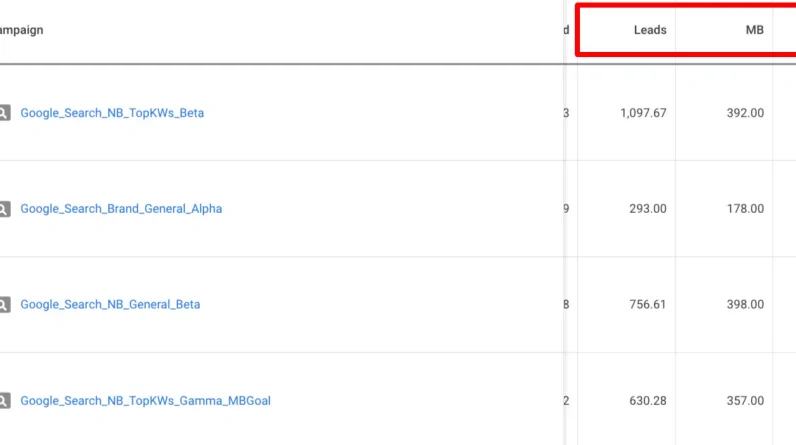
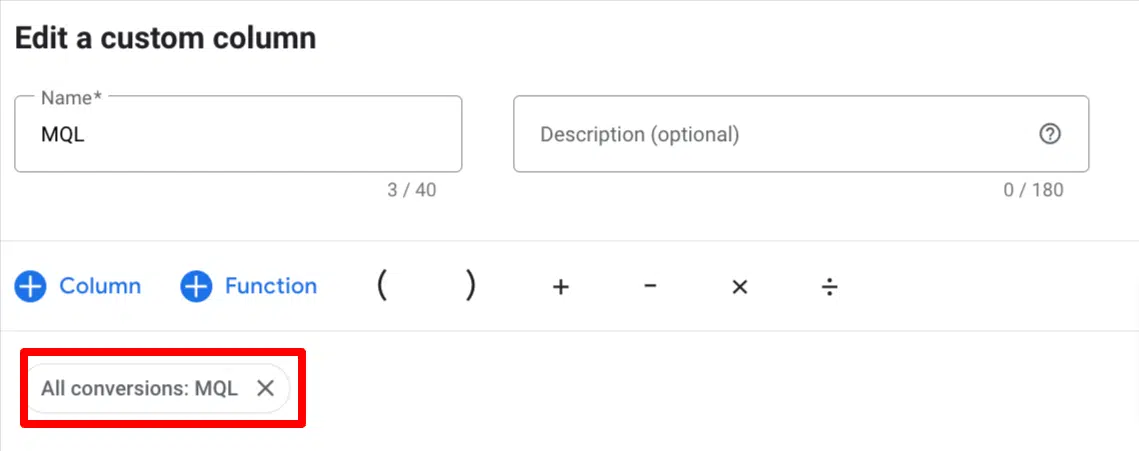
I most often use custom columns to analyze different types of conversion: lead, MQL, SQL, opp, trial, subscriber, etc.
This type of custom column can be used for any industry and any business that uses multiple conversion actions.
The above data gives you very useful information about each conversion stage.
You can also look at different views to see what search terms, keywords, and ads are driving them, allowing you to get very specific about the sites you need to optimize, reduce, or increase your budget.
If you are not using this functionality, you are making optimization decisions based on a cumulative view. This doesn’t matter if you only have one conversion type, but it means you lose a lot of accuracy if you have more than one.
For example, suppose a campaign generates high volumes of leads and MQLs, but rarely generates SQLs.
This may mean that you are investing money in audiences that may love what you have to offer and are taking the desired initial actions, but cannot move past the sales qualification stage due to size or budget.
Knowing this would help you reduce spend without any impact on revenue, and would be great information to feed back to the product team.
Use case 2: Average conversion costs for specific time periods
Another favorite use case is analyzing the average cost per conversion over a given time period, be it yesterday, last week, last 30 days, etc.
I used this for all conversions and by conversion type; it is useful for all scenarios.
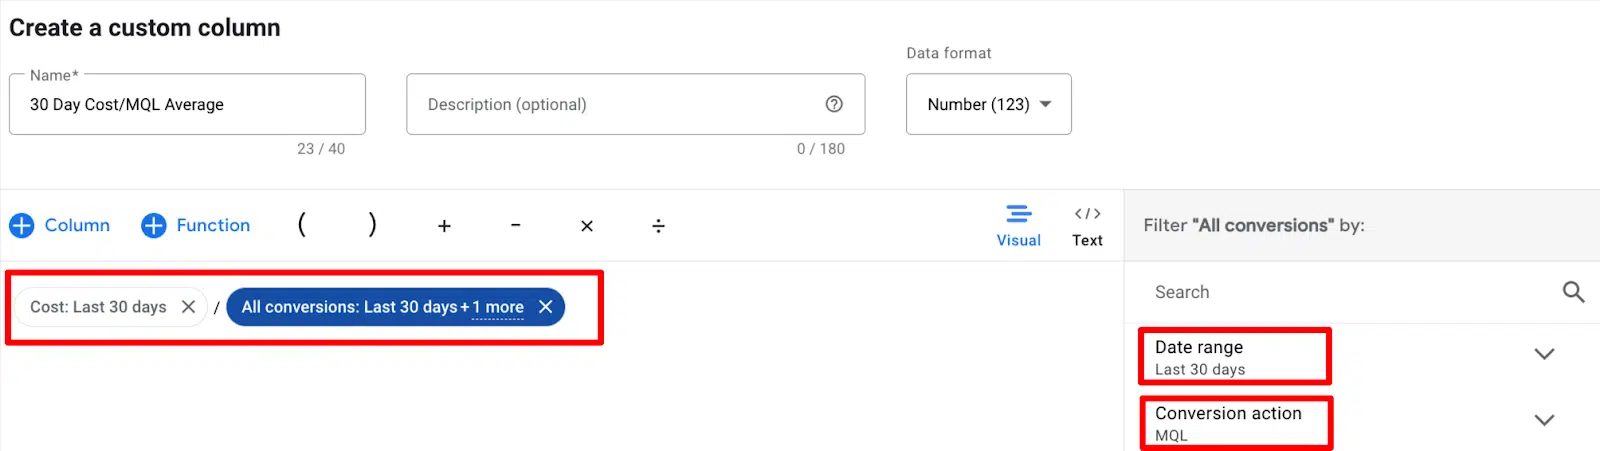
Whatever your time frame, setting the range and comparing metrics to historical data is a great way to see where costs are significantly above or below average.
This allows you to adjust your budgets and bids and helps you catch problems before they snowball. Comparison columns line up much more cleanly than Google’s general user interface.
Get the daily search newsletter marketers trust.
Use case 3: Competitive analysis
Want to look good to your client or executive team?
Create a custom column that examines CTR decreases and CPC increases to gauge potential competition and market activity.
Flagging the data here can help indicate when to check your auction stats to see what’s going on outside.
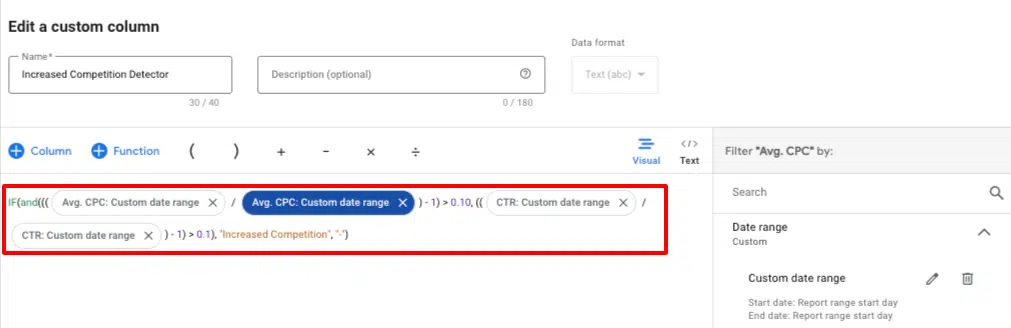
This is very useful for monitoring brand keyword activity (eg competitor poaching), but is also valuable information for non-brand keywords.
Rising costs and competition could be a big trigger to try new ad copy and differentiators (or take on competitors directly in ad copy). And it’s great information to pass on to higher-ups who want information on what competitors are doing.
If you don’t use this column setting, you’re likely to rely too much on auction statistics to detect competitor activity. Auction statistics are useful, but leave a lot to be desired in recognizing trends, a gap that custom columns can close for you.
Use case 4: Spend anomalies
How many of us (raise your hand) have seen Google take liberties with budget limits?
To combat this, I like to create a column to identify spending anomalies. Basically, it marks cases where yesterday’s spend was more than 120% of the average spend of the last seven days.

These fluctuations are important to detect and diagnose in delicate accounts, especially in accounts with a larger budget. By adding this column, you won’t have to rely on your normal reporting cadence to catch them.
Evaluate irregularities at the campaign, ad, and keyword level, and make sure the performance justifies the reasons for the increased spend and that Google isn’t just being a little rogue.
Whether or not performance is the reason for the increased spend, calling out the alerts and subsequent findings is great EQ for your client or manager. In extreme cases, it may require you to interact with your Google representative for some compensation requests.
Using the full functionality of Google Ads
The 2022 updates added tons of agility to custom columns. If I had a wish list for other reporting features, it would be short. (But since I mentioned it, I’d love to see competitive metrics like page top rates and absolute page top rates, plus a less choppy UI to help fix bugs of the formula.)
At this point, it’s up to marketers to learn how to use the full functionality of the tool, which shortens the analysis/action cycle by keeping everything directly in Google’s user interface.
Custom columns can help you display trends and statistics to answer some of the most important questions related to your account.
For even the simplest of ad campaigns, the various views available by date range and formula functionality present an opportunity to move from Google Ads Data 101 to EQ and analytical power, all at the cost of a little elbow grease .
The views expressed in this article are those of the guest author and not necessarily Search Engine Land. Staff authors are listed here.
[ad_2]
Source link