

As Google continues to roll out massive updates, you may be looking to diagnose drops in organic traffic. A great tool to start with here (especially if you’re in the NeverGA4 crowd or your GA4 reports just don’t add up) is Google Search Console.
Google has published a surprisingly useful guide of their own on this topic with some good high-level approaches to this diagnosis.
The guide dives into some of the more obvious Search Console reports for diagnosing crashes:
Comparisons based on dates. Type of search (web, images, video, news). Average position trends. Page reports.
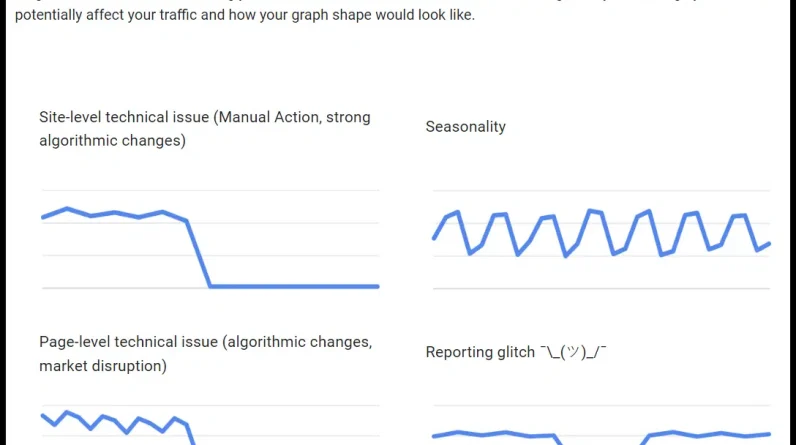
They mention looking at general trend data to see if a drop in traffic might be due to a drop in demand and not specific to your site.
In this article, we’ll go over a few additional Search Console reports that may not be so obvious that you can take advantage of to diagnose traffic issues.
1. Device segmentation
Rankings and where your listing is displayed can change dramatically from mobile to desktop.
Google has become increasingly aggressive with search features and ads (even for branded searches) on mobile in recent years, and the actual results coupled with the screen size of mobile devices can mean that changes like more ads, new SERP features, and/or slight ranking fluctuations can cause big drops in traffic.
For example, here is the desktop result for “best telescope”. Above the fold, we see sponsored results and filters:
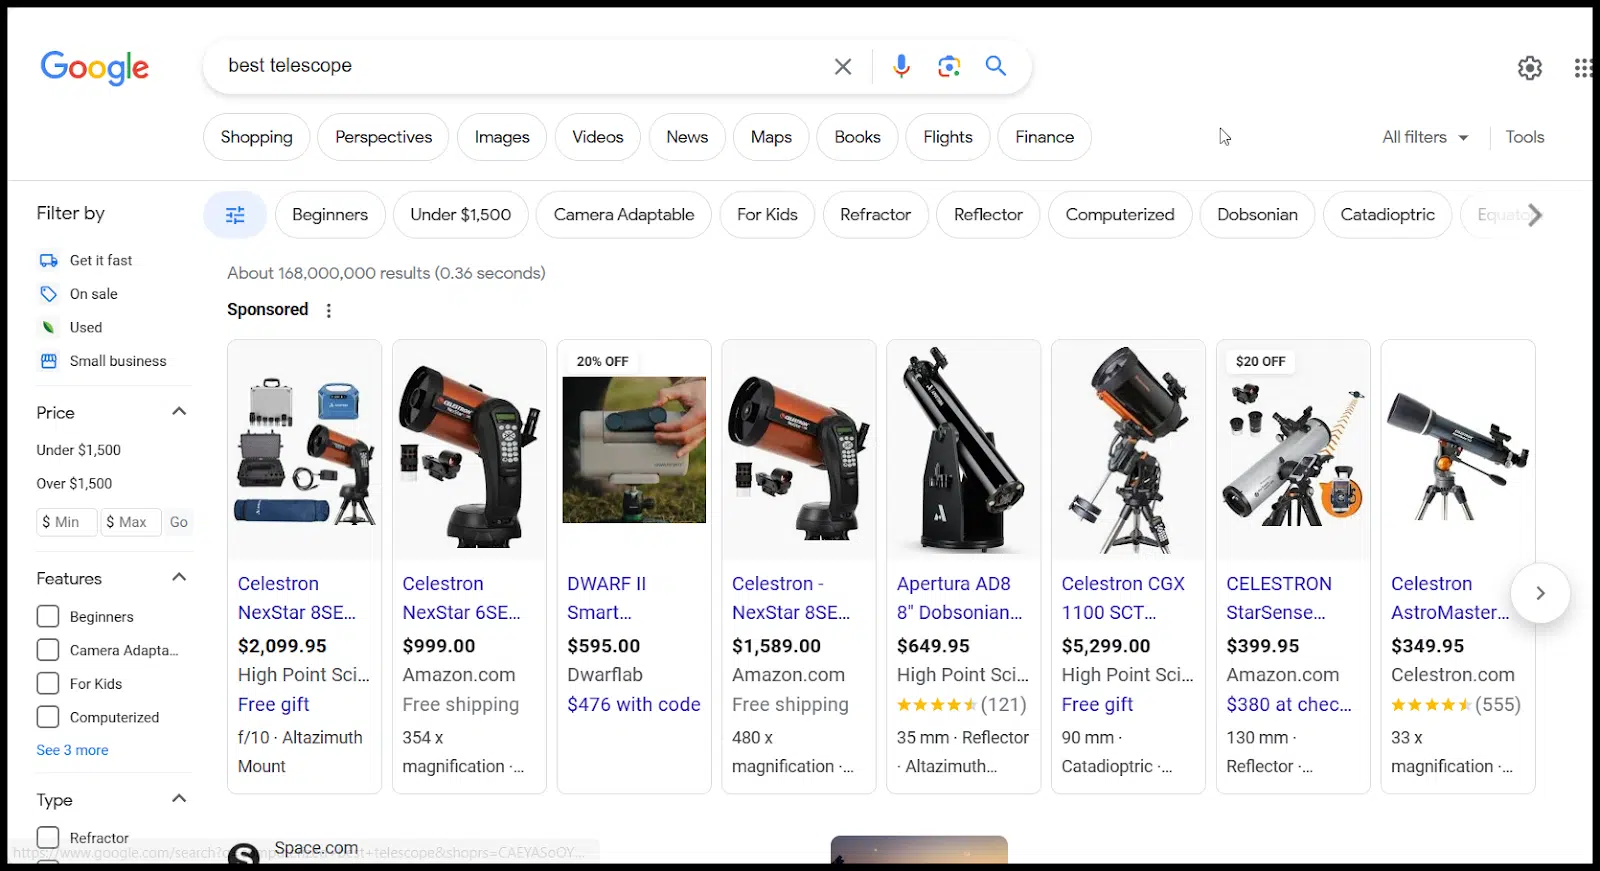
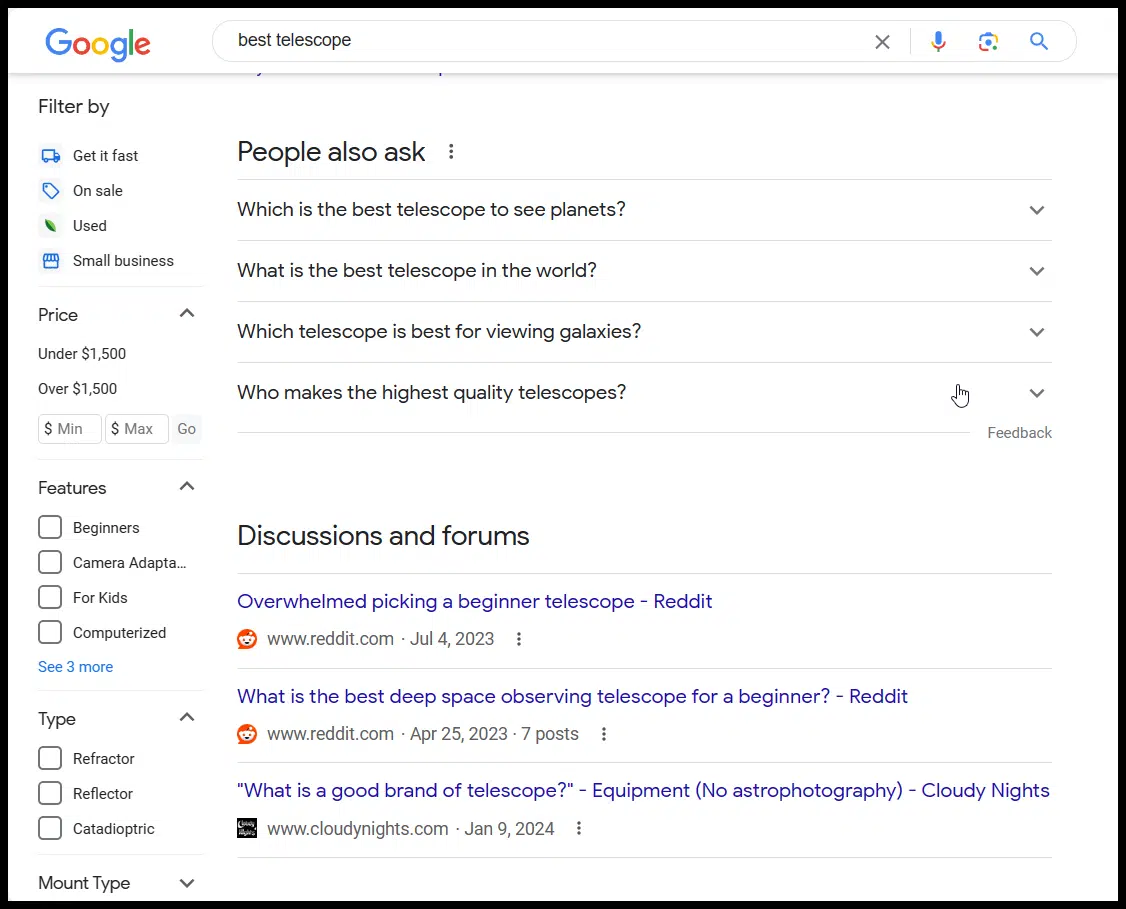
As you scroll, you’ll see:
Two organic listings. A People Also Ask section. Discussions and forums (2 Reddit threads and a niche forum). Another organic listing. A “buying guide” (search function similar to what people are also asking about). A Reddit listing.
If you were ranked 4th before some of these new elements were added, you may still rank 4th in the organic listings, but you have very little chance of showing up on desktop.
The mobile search result here is even worse if you rank organically. On mobile, for the same query, we see:
Shopping results. Two ads. An organic listing. People also ask. A great Reddit list. Another organic listing. Debates and forums.
Astronomy Magazine ranks second in desktop search results, but third on mobile. This third list is below all the items I listed above. If you were diagnosing a drop in traffic, understanding the different rankings on different devices and how the results have changed on both mobile and desktop can be the key to understanding why your traffic dropped.
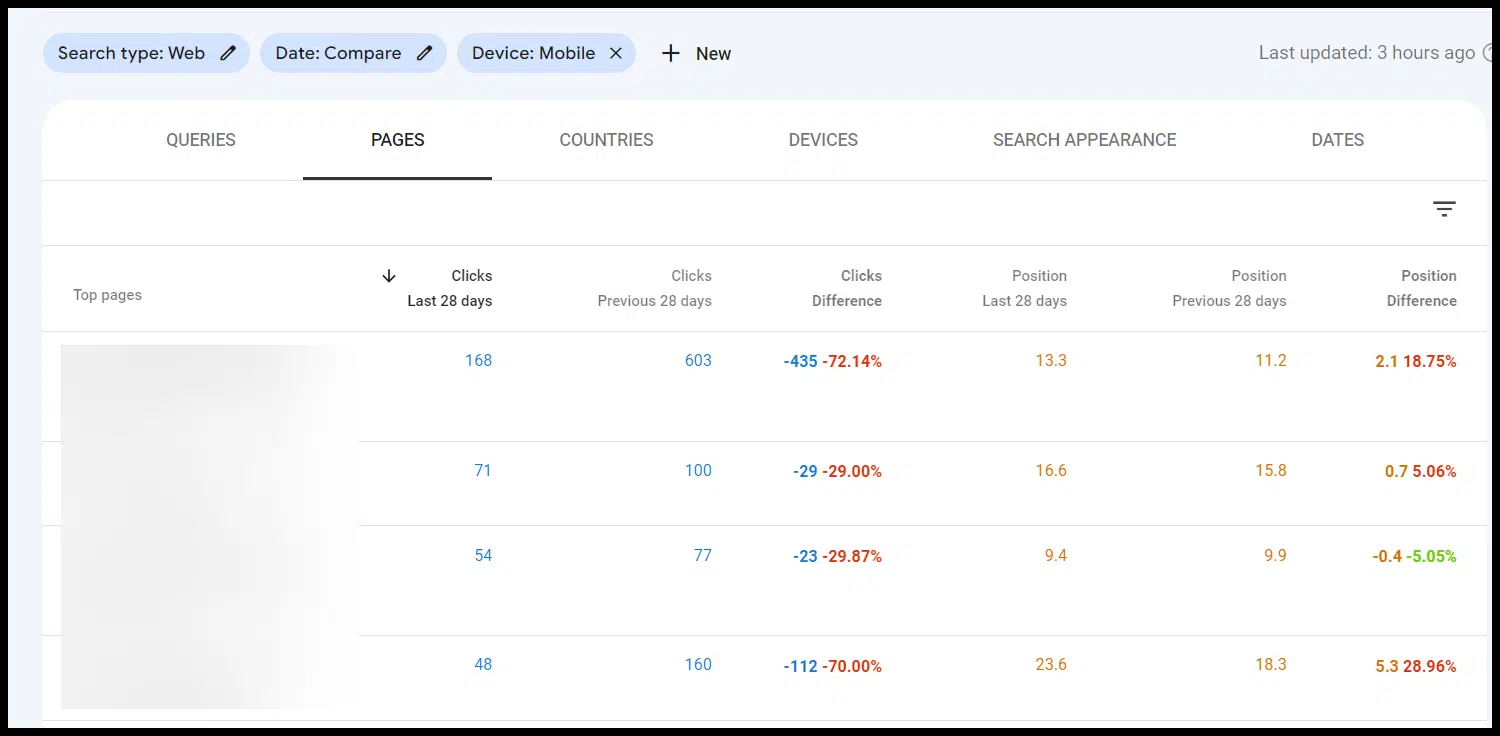
To access device-specific data, you can start by drilling down to Performance > Search Results > Devices within GSC and then layering in a date-based comparison.
This can give you a quick picture of where traffic is declining most aggressively.
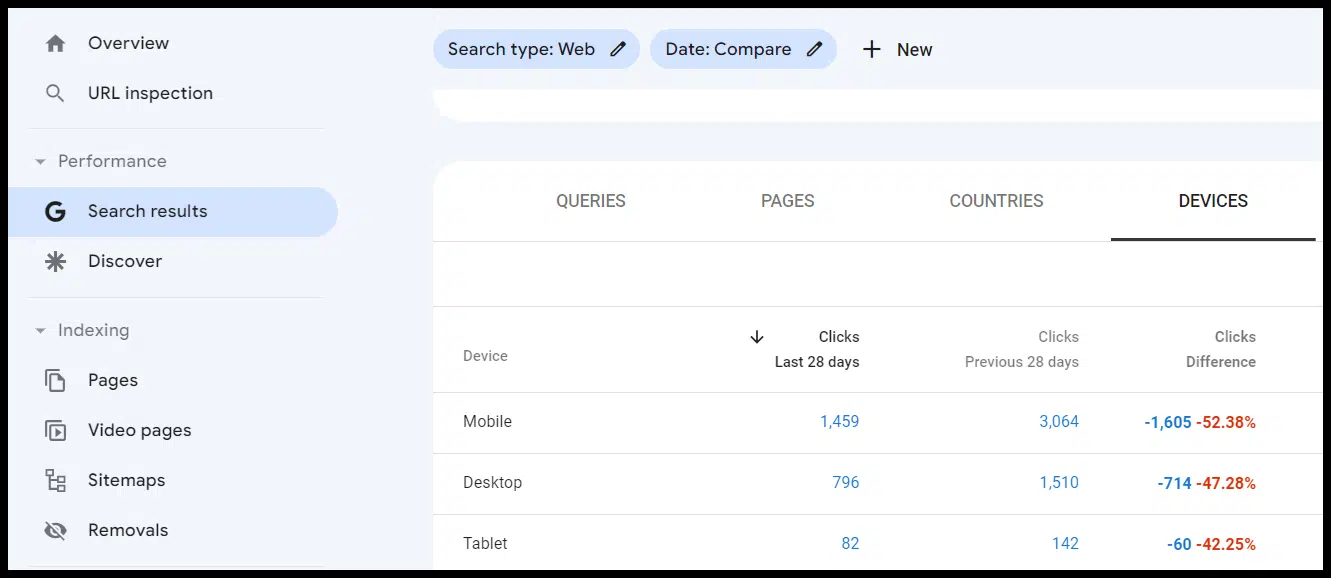
(In the screenshot above, I used a free chrome extension add percentages to get an even quicker picture of where the most traffic was lost).
In this case, the drop is pretty evenly distributed, but if it wasn’t, I could add a filter for the type of device that lost the most total traffic and saw the biggest percentage drop:

From there, you can check the pages and queries reports to see where the biggest drops in clicks (and the corresponding change in average position) for pages and queries are:
Get the daily search newsletter marketers trust.
2. Search aspect
The Search Appearance report can also help you understand whether specific search features are costing you clicks and impressions:
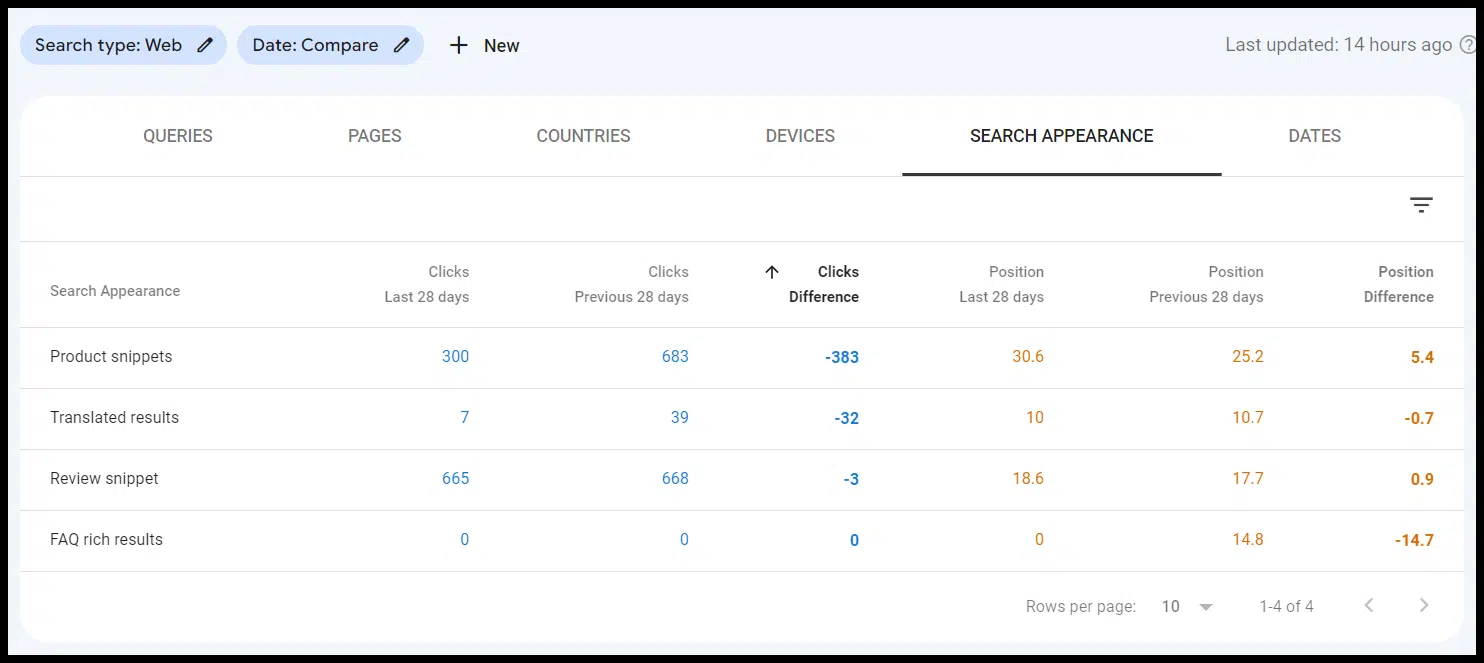
Remember that not all traffic drops are the result of a standard algorithm update or manual action.
You may be losing ground due to SERP design or your listings may be displayed differently in certain SERP features.
You can also track featured snippets for your top keywords using third-party tools.
3. Tracking Statistics
The crawl statistics report is somewhat hidden in the Search Console interface (under Settings), so it’s probably not used:

However, once you find the report, you can drill down into a few different aspects.
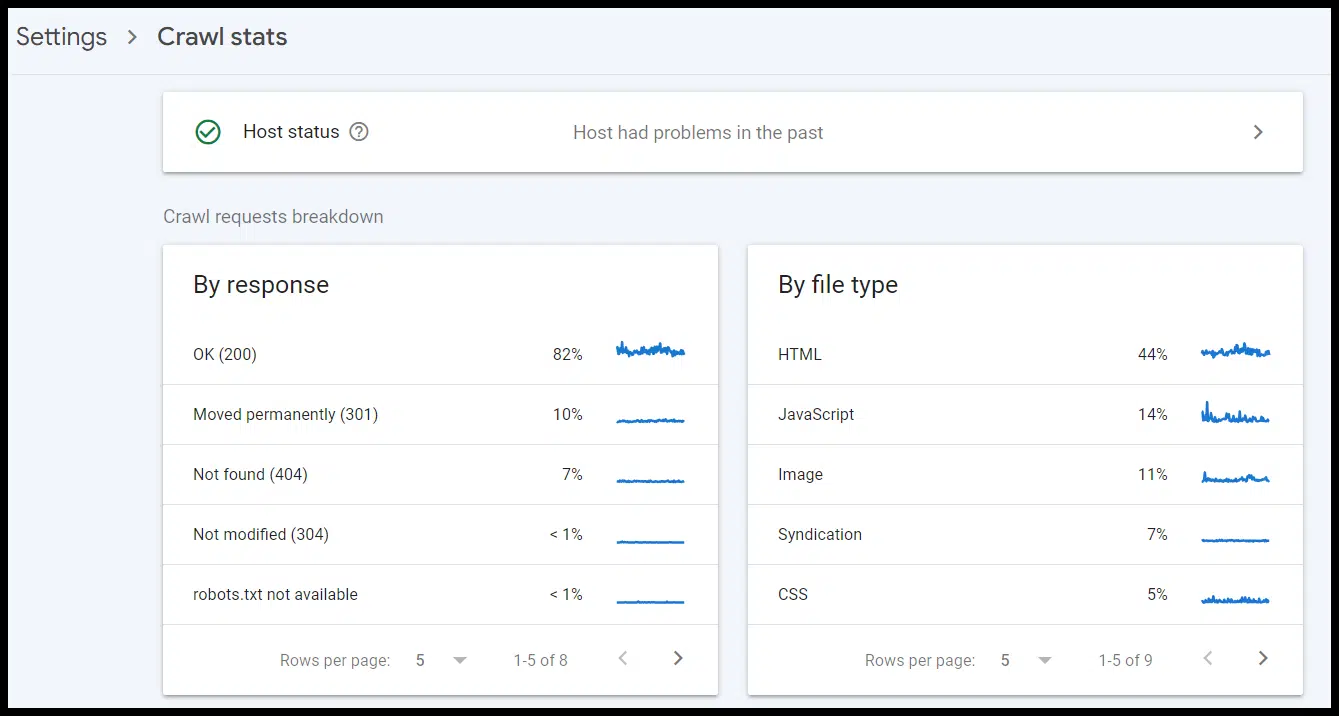
Specifically, you can look at:
Errors. Redirected URLs. URLs crawled by subdomain (if applicable/a domain-level property). Specific URLs are being crawled.
The report also gives you trending data to see when there may be spikes in these areas to identify specific issues, such as a batch of broken links or redirects, an increase in crawl budget being allocated to a specific group of pages or a specific subdomain, or a large drop in crawled URLs that may indicate a technical issue with your site.
For larger sites, log file data and analysis may be more useful than this report, but for many sites, Search Console’s Crawl Statistics report can be a very useful free resource for diagnosing tracking problems
Dig deeper: Why server logs are important for SEO
The views expressed in this article are those of the guest author and not necessarily Search Engine Land. Staff authors are listed here.
[ad_2]
Source link