

This year’s Super Bowl LVIII saw a record attendance 123.4 million viewers. The Kansas City Chiefs beat the San Francisco 49ers in a thrilling game by a final score of 25-22.
But beyond the game itself, another competition was taking place: to determine which of the 59 ads that aired was the most effective ad.
Analyzing ad effectiveness is a complex task that requires looking beyond viewer numbers to metrics that measure real business results.
This article explores different methodologies and KPIs used to evaluate Super Bowl ads, favoring metrics such as engagement view conversions that link advertising directly to customer actions and sales.
Measuring Ad Effectiveness: Top 2024 Super Bowl Ads
Dome ad agencies can tell their clients that over 100 million people watched last year’s Super Bowl, so we can expect even more people to have tuned in to see Taylor Swift kiss her boyfriend, Travis Kelce, after the big game.
OK, maybe a percentage of that audience missed a brand’s TV ad because they were in the kitchen making more snacks. But even if a substantial portion of the Super Bowl audience saw a brand spot, which cost roughly $7 million for 30 seconds of air on CBS, that doesn’t mean it was effective.
This year’s big game was played between 59 commercials. If you use a brand lift survey to measure metrics like ad recall, brand awareness, and consideration, you’ll find that only a portion of Super Bowl 2024 ads would be considered effective.
This is why showing up is necessary but not sufficient to “win”.
However, I suspect that 10 advertising agencies told their clients that they “won” because they were among “Top 10 commercials from Super Bowl 58,” according to USA TODAY Ad Meter.
Well, congratulations to them. Here are the top eight (which earned an average score of at least 6 out of 10):
But digital marketers who know how to measure what matters should remind their brands and ad agencies that USA Today created the Ad Meter methodology in 1989. And in 2024, it said:
participants: Any US citizen 18 years of age or older can participate as an Ad Meter panelist.
Rating system: Each participant rates each ad on a scale of 1 to 10, with 10 being the highest score.
Categories: Some ads are not eligible for Ad Meter, including ads that only run on digital platforms.
Therefore, Ad Meter may not be an “accurate indicator of what consumers think about the most expensive ads on TV.” USA Today says, “We expect brands to use social media as a way to promote a campaign.”
Are there better ways to measure the most effective Super Bowl 2024 ads? Yes, there is.
For example, to sing used the LINK AI tool, which predicts creative effectiveness, to rank this year’s Big Game ads. However, only 12 of them achieved “top performing” status based on their priority metrics: impact, power and enjoyment. Here are Kantar’s top five announcements:
Finally, DAVID used its content testing platform, which includes facial coding, eye tracking and survey responses, to measure the Super Bowl 2024 ads with the greatest emotional and business impact on viewers. A total of 4,950 American respondents participated in the study, which did not include movie trailers.
Here are the 10 most effective Super Bowl 2024 ads:
“NFL Super Bowl LVIII || Born to Play”, (7.45). “DON’T FORGET UBER EATS”, (7.23).
Ian ForresterCEO and founder of DAIVID, said:
“The NFL Big Game spot elicited strong positive emotions among 66.5% of the audience (+29.1% compared to the US norm). With the vast majority of ads this year seeking to entertain viewers, the ad stood out for evoking inspiration (29.7%), awe (24.1%), hope (21.4%) and warmth (21 .4%). This exceptional emotional response, combined with strong attention (74.5%, +4.9% vs. norm) and excellent brand recall (83.5%, +20.0% vs. norm), won the ad’s top honors.”
So what metrics should digital marketers be using?
Or, as Alice asks in Lewis Carroll’s Alice’s Adventures in Wonderland, “Would you please tell me which way to go from here?” And, as the Cheshire Cat replies, “That really depends on where you want to go.”
But customers want to reach further than the so-called top of the funnel. With Google Analytics 4 (GA4) enabling brands and businesses to measure engagement view conversions (EVCs), I would advise ad agencies to learn how to track when someone has watched a YouTube video for at least 10 seconds and then made a conversion on your client’s website. three days after watching the video.
Get the daily search newsletter marketers trust.
Why adopt this new metric as an ad effectiveness KPI?
In accordance with Google Ads Help:
“YouTube video viewers have high intent to watch the content they came to YouTube for, so they’re more likely to stay on the platform when they encounter an ad as part of their viewing experience.” This explains why people often don’t take action directly after watching a video ad.
However, they often take action after the full viewing session is over. This explains why “70% of YouTube viewers say they bought a brand as a result of finding it on YouTube.”
This is where EVCs come in. Counted when a user watches at least 10 seconds of a skippable in-stream ad (or watches the entire skippable in-stream ad, if less than 10 seconds) and then converts within EVC window. .
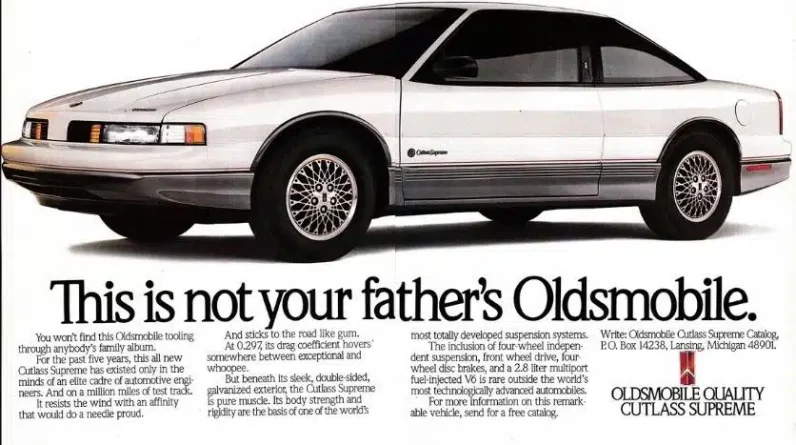
Brands and their ad agencies couldn’t measure it in 1989, when the Ad Meter methodology was created. If they could do that, I’m sure my dad, who was the marketing director at Oldsmobile at the time, would have used this KPI to measure the impact of his classic campaign, which proclaimed, “This is NOT your dad’s Oldsmobile “.
Ironically, it was my father’s Oldsmobile. I learned a painful lesson from my father that has dramatically influenced my choice of marketing KPIs for over 35 years:
Measure results, not results.
The typical business model for advertising agencies in the late 1980s was based on the amount of media they bought on behalf of their clients.
Therefore, most advertising agencies used gross rating points (GRP) to measure the size of an audience that a specific advertising campaign reaches.
GRPs were often used in the context of television advertising, where they represented the total number of impressions (the number of times an ad was shown) generated by a specific television schedule.
Now, automotive marketers need consumers to:
Be aware of your brand. Have a favorable opinion of your brand. Consider buying their brand. You intend to buy the brand the next time they are on the market.
So sometimes the agency’s focus on metrics like GRPs is aligned with the client’s goal of brand awareness, favorability, consideration and purchase intent.
But sometimes it isn’t. Because? Because it’s a myth that all advertising increases sales to some extent. it doesn’t
As David Ogilvy observed in his classic book “Ogilvy on Advertising,” the wrong kind of advertising can hurt sales. He referenced a survey that showed lower beer consumption among people who remembered his ads than those who didn’t. Indeed, “the brewer had spent millions of dollars on advertising that didn’t sell his beer.”
My father also learned this painful lesson when his classic advertising campaign, which proclaimed, “This is not your father’s Oldsmobile,” failed to sell 62.5% of its target audience in less than five years.
Before the ad campaign was launched, Oldsmobile had sold 1.2 million cars in 1986, making it the third leading car brand in the US, behind only Chevrolet and Ford.
Its advertising campaign featured celebrities such as William Shatner and Ringo Starr driving a new Oldsmobile with their daughters.
The ad campaign made the phrase “This ain’t your dad’s Oldsmobile,” a meme that many older consumers still remember today. But Oldsmobile sales fell to 900,000 in 1987, 800,000 in 1988, 700,000 in 1989, 600,000 in 1990 and 450,000 in 1991.
During this time, my father asked his advertising agency, Leo Burnette, how they measured the results of the advertising campaign. They answered, “GRPs.” This led my father to ask them, “How many GRPs do we need to sell a car?”
Now, General Motors had many other problems, so it filed for bankruptcy in 2009 and shut down several brands, including Pontiac, Saturn, and Hummer.
But Oldsmobile’s 107-year history ended five years earlier in 2004. So I’d say measuring the results of an ad campaign with GRP knocked about five years off the life of the second most popular brand in GM.
So the lesson I learned from my father is to measure outcomes, not results. And it’s one I’d like to share with digital marketers in 2024. I’m just paying it forward.
Dig Deeper: SEO results vs. SEO exits: understand the difference
The views expressed in this article are those of the guest author and not necessarily Search Engine Land. Staff authors are listed here.
[ad_2]
Source link